Analytics
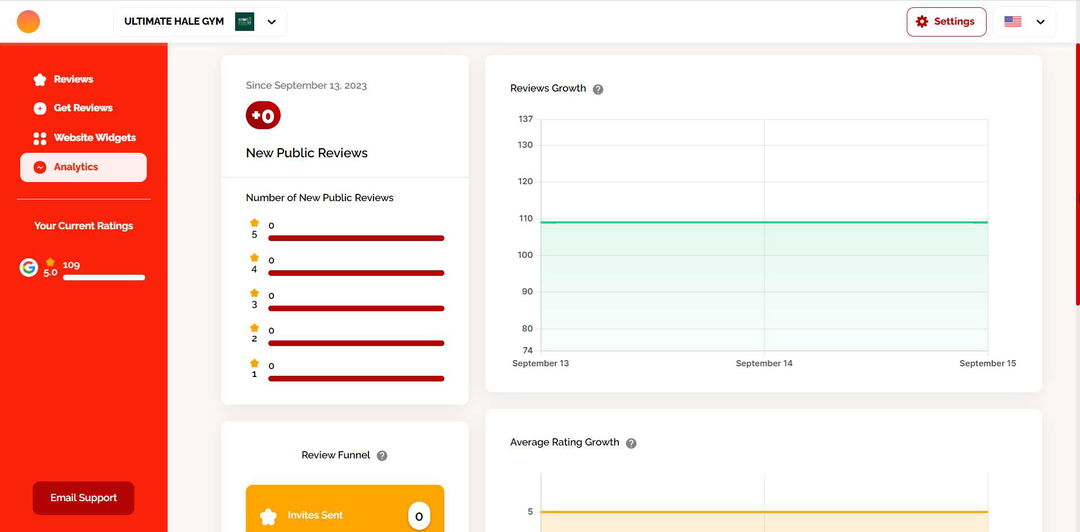
Dashboard/analytics section enables you the opportunity to visualize your growth with charts, populated with data that’s updated once a day.
Dashboard/analytics section shows Number of New Public Reviews; Reviews Growthchart, representing the number of reviews over time; Average Rating Growth representing the average of the reviews over time, which have been normalized on a scale from 1 to 5.
Reviews Funnel consists of:
Invites Sent: Total number of email, SMS and WhatsApp campaigns sent in the selected time frame.
Total Visits: The total number of visits to your Review Link in the selected time frame.
QR Code Visits: the total number of visits to the Review Link deriving from the QR code in the selected time frame.
New Public Reviews: reviews on public platforms (e.g. Google) in the selected time frame. Video reviews and private reviews are excluded.
Negative Feedbacks: private reviews resulting from negative customer experiences in the selected time frame.

